Die Autoren stellen fest: "...the probabilities that the observed temperature series are natural have values roughly between 40% and 90%, depending on the stations characteristics and the periods considered. 'Natural' means that we do not have within a defined confidence interval a definitely positive anthropogenic contribution and, therefore, only a marginal anthropogenic contribution can not be excluded."
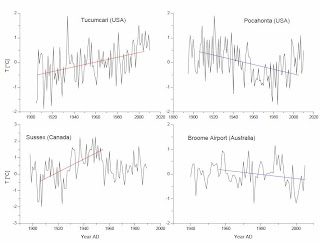
Während des hundertjährigen Beobachtungszeitraums zeigte ein Viertel der Stationen fallende Temperaturen, was in sich selbst "is an indication that the observed temperature series are predominantly natural fluctuations", so Lüdecke und seine Mitarbeiter. Die folgende Grafik gibt dafür Beispiele (Quelle: Seite 10, Fig. 4 der obigen Arbeit):

Erläuterung: "The linear regression lines of the records Tucumcari and Pocahonta are for the period 1906 - 2005, of the record Sussex for 1906 - 1955 and of the record Broome Airport for 1955 - 2005".
Die nächste Grafik zeigt die Trendumkehr im Temperaturverlauf des 20. Jahrhunderts, die Ausdruck der damaligen Abkühlung (blaue Linie) ist, die für einige Jahrzehnte die globale Erwärmung (rote Linien) unterbrach. Auch das ist ein Beweis dafür, dass das atmosphärische Kohlendioxid kein Klimatreiber ist, denn während jener Abkühlungsperiode stieg der CO2-Gehalt der Atmosphäre ständig an. Bildquelle: Seite 14, Fig. 8.

Erläuterung: "An own global record evaluated from 581 stations, each in areas with populations of under 1000 ..., with linear regression lines for the interim periods 1901-1934, 1934-1979, and 1979-2010 (black). The record was evaluated by basic averaging and normalizing local records; global record provided by GISS (green)."
Die statistische Analyse von Lüdecke u. a. bestätigt die auf Beobachtung beruhenden Ergebnisse folgender Autoren:
- Idso, S.B. 1998. CO2-induced global warming: a skeptic's view of potential climate change. Climate Research 10: 69-82.
- Lindzen, R.S. und Choi, Y.-S. 2009. On the determination of climate feedbacks from ERBE data. Geophysical Research Letters 36: 10.1029/2009GL039628.
- Lindzen, R.S. und Choi, Y.-S. 2011. On the observational determination of climate sensitivity and its implications. Asia-Pacific Journal of Atmospheric Sciences 47: 377-390.
- Scafetta, N. 2012. Testing an astronomically based decadal-scale empirical harmonic climate model versus the IPCC (2007) general circulation climate models. Journal of Atmospheric and Solar-Terrestrial Physics: 10.1016/j.jastp.2011.12.005.


Keine Kommentare:
Kommentar veröffentlichen